
Published by Glen Molotnikov on
Mitophagy is the selective degradation of old or depolarized mitochondria by autophagy, mitophogy contributes to maintaining a healthy population of mitochondria. Since damaged mitochondria leads to collapsed cell homeostasis, mitophagy is believed to protect against diseases related to mitochondrial dysfunction such as neurodegenerative disorders, most importantly Parkinson's Disease.
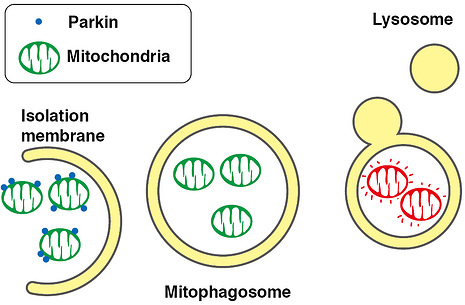 Parkin, an ubiquitin ligase known as the gene responsible for Parkinson’s disease, plays an important role in autophagic elimination of mitophagy. When mitochondria are depolarized and dysfunctional, PTEN-induced putative kinase protein 1 (PINK1) accumulates on the outer membr. Parkin is recruited on the damaged mitochondria. The outer membrane on the mitochondria is then ubiquitinated through the ubiquitin ligase activity of Parkin. The poly-ubiquitinated mitochondria are selectively recognized and executed by autophagic process. Using the flourescent protien Keima, this process can be visualized.

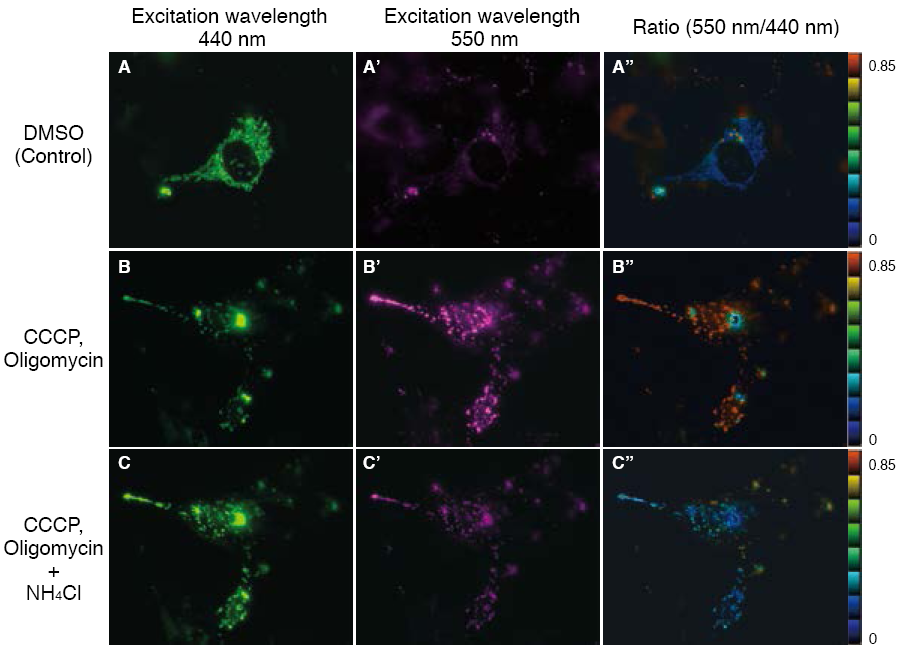
The fluorescent protein Keima has an excitation spectrum that changes according to pH. A short wavelength (440 nm) is predominant for excitation in a neutral environment, whereas a long wavelength (586 nm) is predominant in an acidic environment. When observing a ratio (586 nm/440 nm) image obtained from image data by using these two excitation wavelengths, Keima in a neutral environment has a low ratio value and is displayed in blue. In an acidic environment, Keima has a high ratio value and is displayed in red.
When MT-mKeima-Red, which is the Keima tagged with a mitochondria targeting signal peptide sequence, and Parkin is expressed in target cells, mitophagy is detected and visualized through the difference in fluorescent wavelengths observed before and after drug treatment.
Mitophagy is induced by administration of CCCP and oligomycin, drugs that affect mitochondrial membrane potential, and is observed with 550 nm/440 nm ratio images (A”, B”, C”).
Through mitophagy induction, the mitochondria-localized MT-mKeima-Red is displayed in red in ratio images, showing its localization in an acidic environment (B-B”). The neutralizer NH4Cl is then administered, which forces the entire cell into a neutral environment, and the image returns to blue (C-C”).
This result matches findings in which the progression of mitophagy causes mitochondria to be engulfed in lysosomes when in an acidic environment.
| Fluorescent Protein | Targeted Organelle |
| mKeima-Red | Mitochondria |
| mKeima-Red | Plasma membrane |
| hdKeima-Red | Nucleoplasm |
Citations
- Safiulina, D., & Kaasik, A. (2013). Energetic and Dynamic: How Mitochondria Meet Neuronal Energy Demands. PLoS Biology, E1001755-E1001755.
- Togashi, K., Wakatsuki, S., Furuno, A., Tokunaga, S., Nagai, Y., Araki, T., & Arakawa, H. (2013). Na /H Exchangers Induce Autophagy in Neurons and Inhibit Polyglutamine-Induced Aggregate Formation. PLoS ONE, E81313-E81313.
- Narendra, D., Wang, C., Youle, R., & Walker, J. (2013). PINK1 rendered temperature sensitive by disease-associated and engineered mutations. Human Molecular Genetics,2572-2589.
- Bingol, B., Tea, J., Phu, L., Reichelt, M., Bakalarski, C., Song, Q., ... Sheng, M. (2014). The mitochondrial deubiquitinase USP30 opposes parkin-mediated mitophagy. Nature.